Python: for programming and scripting
Python is a widely used high-level programming language that is known for its simplicity, readability and versatility. It is used in a wide range of applications, including web development, data science, scientific computing, artificial intelligence, and many others.
One of the key features of Python is its simplicity and ease of use. Python's syntax is simple and easy to read, making it a great language for beginners to learn programming. Additionally, Python provides a large standard library that includes modules for a wide range of tasks, such as connecting to web servers, reading and writing files, and working with data. This makes it easy for developers to perform common tasks without having to write a lot of code.
Another feature of Python is its versatility. Python can be used for a wide range of tasks, from web development to data science, and it has a large and active community that supports it. This means that there are a lot of libraries and frameworks available for Python, such as Django for web development, Pandas for data manipulation, and TensorFlow for machine learning. This makes Python a great choice for developers who want to work on a wide range of projects.
Python is also widely used for scripting, it's easy to use and simple syntax makes it a great tool for automating tasks, such as web scraping, data processing, and system administration. Python can be used to write scripts that can automate repetitive tasks, making it easy to automate repetitive and time-consuming tasks, such as data entry and report generation.
In conclusion, Python is a widely used high-level programming language that is known
Visual Studio Code: for code editing
Visual Studio Code is a free, open-source code editor developed by Microsoft. It is available for Windows, macOS, and Linux. It supports a wide variety of programming languages and has a wide range of features including debugging, Git integration, and a built-in terminal. Additionally, Visual Studio Code offers many extensions that can be installed to add extra functionality such as support for additional languages and tools. It is a popular choice among developers due to its flexibility and extensibility.
Postman: for API testing
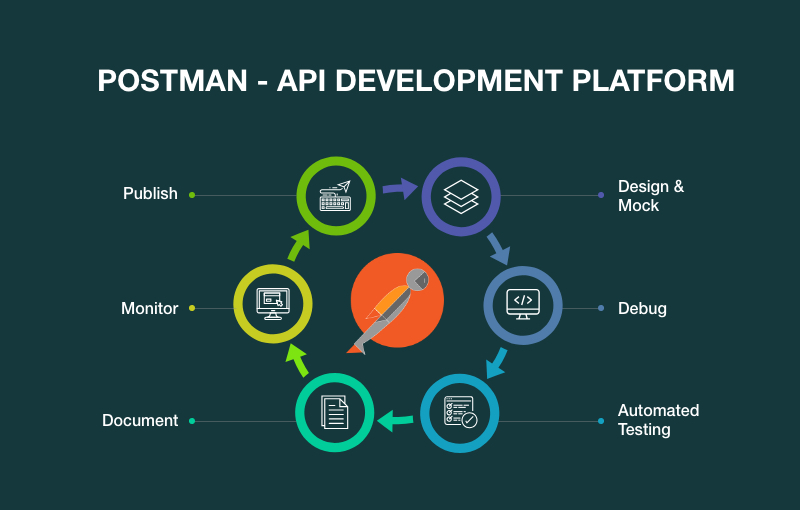
Postman is a popular tool for testing and developing APIs (Application Programming Interfaces). It allows developers to test and debug APIs easily, by making requests to the API and analyzing the responses. It can be used for testing RESTful and SOAP APIs, and is available as a native app for Windows, Mac, and Linux, as well as a browser extension.
One of the key features of Postman is its ability to make requests to an API and analyze the responses. It allows developers to test different types of requests, such as GET, POST, PUT, DELETE, etc. and check the responses for errors or unexpected behavior. Developers can also add headers, parameters, and body to the requests, making it easy to test different scenarios.
Another feature of Postman is its ability to save and organize requests in a collection. This allows developers to group related requests together, making it easy to test different parts of the API and to share the requests with others. Additionally, Postman also supports environments, which allows developers to switch between different configurations and settings, making it easy to test the same requests against different servers or with different data.
Postman also provides a feature called scripts, which allows developers to automate repetitive tasks or to add custom logic to the requests. Developers can use scripts to add pre-request and test scripts to requests, which can be used to set variables, perform calculations, and to validate responses.
In conclusion, Postman is a popular tool for testing and developing APIs. Its ability to make requests to an API and analyze the responses, the ability to save and organize requests in a collection, and the support for environments and scripts make it a powerful tool for testing and debugging APIs. It's easy to use interface and wide range of features make it a popular choice among developers and QA engineers.
Tableau: for data visualization
Tableau is a popular data visualization tool that allows users to easily and quickly create interactive, visually appealing and informative dashboards, charts, and maps. It is widely used in business intelligence, data analysis, and data science.
One of the key features of Tableau is its ability to connect to a wide variety of data sources, including spreadsheets, databases, and cloud platforms, and to visualize that data in a variety of ways. Users can create charts, maps, and other types of visualizations with just a few clicks, and can also customize those visualizations using a wide range of formatting options. Tableau also provides drag-and-drop functionality to make it easy to explore and analyze data.
Another feature of Tableau is its ability to create interactive dashboards, that allow users to explore data by drilling down into specific details, and to filter and highlight specific data points. This makes it easy for users to find insights and patterns in the data, and to share those insights with others. Additionally, Tableau also provides a feature called "storytelling" that allows users to create a series of dashboards that tell a story with the data, making it easy to communicate insights to others.
Tableau also provides a feature called "calculated fields" that allows users to create new fields by combining, transforming, or analyzing existing data. This feature allows users to create new metrics and indicators, and to perform calculations on the data, making it easy to analyze data in new ways.
In conclusion, Tableau is a powerful data visualization tool that allows users to easily and quickly create interactive, visually appealing and informative dashboards, charts, and maps. Its ability to connect to a wide variety of data sources, its drag-and-drop functionality, and its ability to create interactive dashboards, story telling feature and calculated fields make it a popular choice for data analysis and business intelligence.


![[Download] Whatsapp DP Images ✅ Whatsapp Profile Pictures](https://blogger.googleusercontent.com/img/b/R29vZ2xl/AVvXsEiA91BRwYG5DedFYpMdoyylxsS7zbFCp-nDvQYbuzuYq2c7v8fMoiLnw3VXyV-YRCvIGY1X8nIX3nAxfSIrwHCYDZ0C83ldFP3GkIz5MvoeNzH3OXRlfIaDUPEihdaox8BsF71CNfcOp6fn/w680/whatsapp+dp+%25281%2529.jpg)
